Leading commodities
| Commodity | Production (t) | Rank in Lampung |
|---|---|---|
| Paddy | 526,198 | #2 |
| Corn — Bar chart 469.757; map label prints 496.757 — bar value used | 469,757 | #2 |
| Cassava | 1,939,466 | #2 |
| Coconut | 12,431 | #3 |
| Cacao | 3,750 | #4 |
| Vannamei Shrimp — Bar 5.764; map label prints Vannamei 4.344 + Windu 1.419 (=5.763 combined) | 5,764 | #4 |
| Pepper | 1,385 | #5 |
| Tiger (Windu) Shrimp — Map label | 1,419 | — |
Production of leading commodities
tons
Source: Disperindag 2026 via FOILA 2026 p.11–18
Energy & water
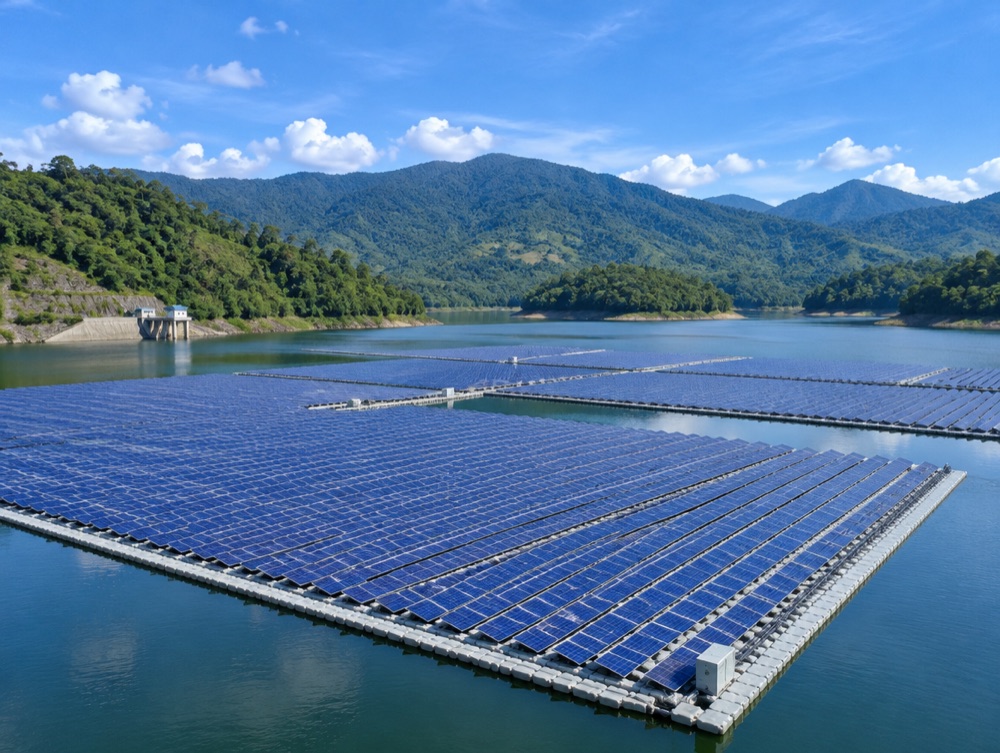
solar
Marga Tiga
potential (floating solar at dam)
solar
Way Jepara
25 MW · potential
hydro
Margatiga Dam micro hydro
planned
dam
Margatiga Dam
147.94 million m³ · 1,921 Ha inundation · Irrigation, micro hydro electrical builder 2 x 27 MW and raw water
Tourism
other
Way Kambas
Elephant conservation, Lampung's natural heritage · 92 km from Bandar Lampung
Workforce, land price, demographics and investment-realisation data per regency are not yet in the database. They will be added in phase 2 (BPS, Disnaker, DPMPTSP).
Explore East Lampung with us
Our Investor Desk helps you with site visits, data requests, permits and introductions to local partners — free of charge.